Production Overview
As a Producer, having a comprehensive overview of the entire production process is essential.
Kitsu offers various tools to help you stay informed and manage production efficiently without getting overwhelmed by notifications or losing focus.
News Feed Features
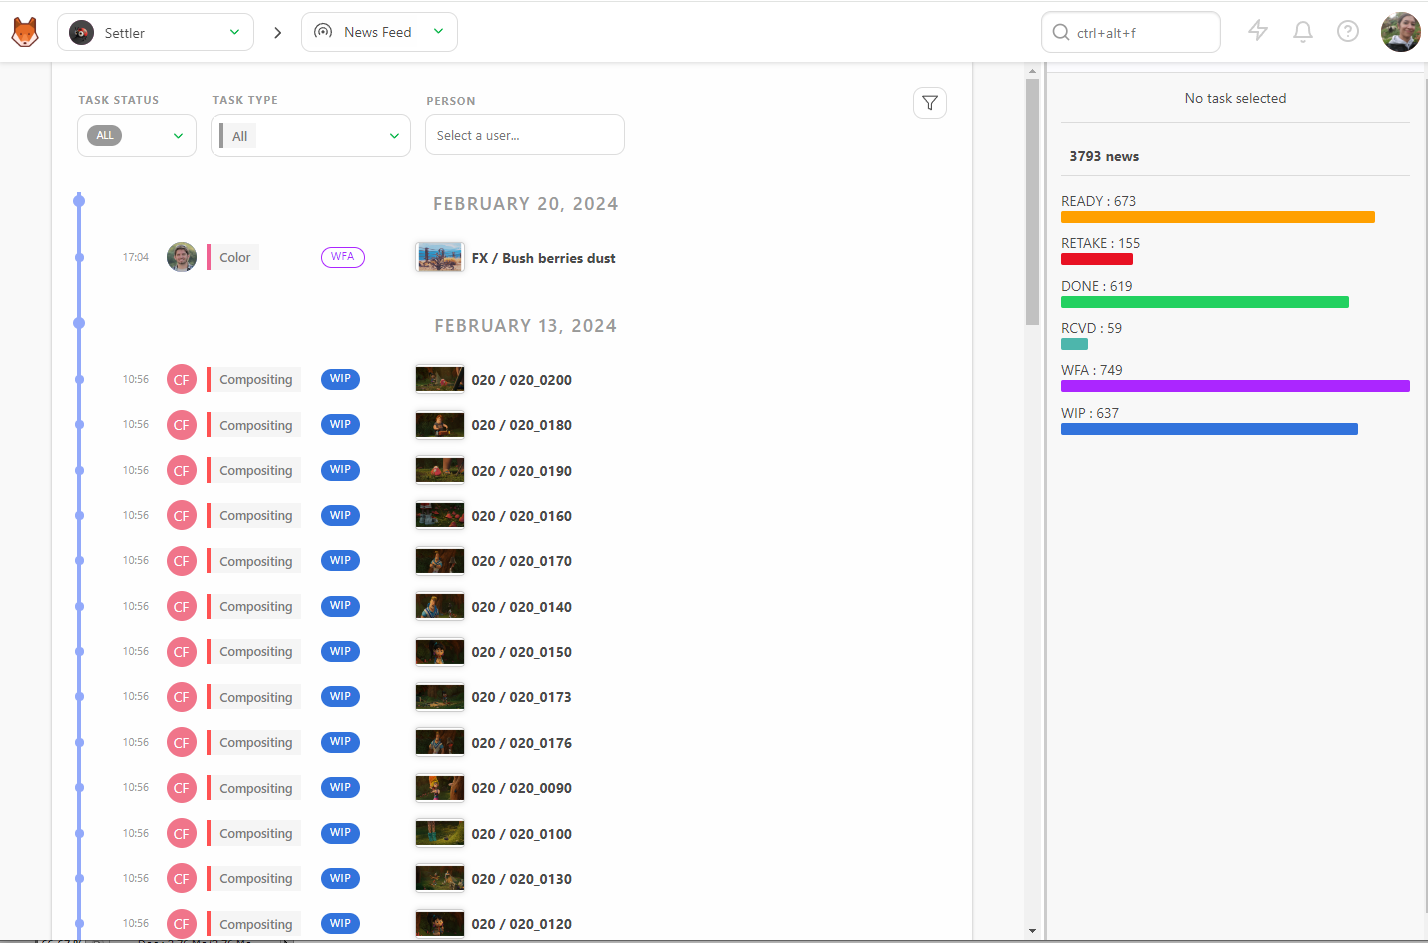
The news feed section show real-time updates relating to your production, including:
- Real-Time Updates: View all status changes as they happen, minute by minute.
- Summarized View: The right part of the screen displays the total number of news items and a breakdown by status.
- Filtering Options: Filter the list by Task Status, Task Type, and Person to focus on specific areas.
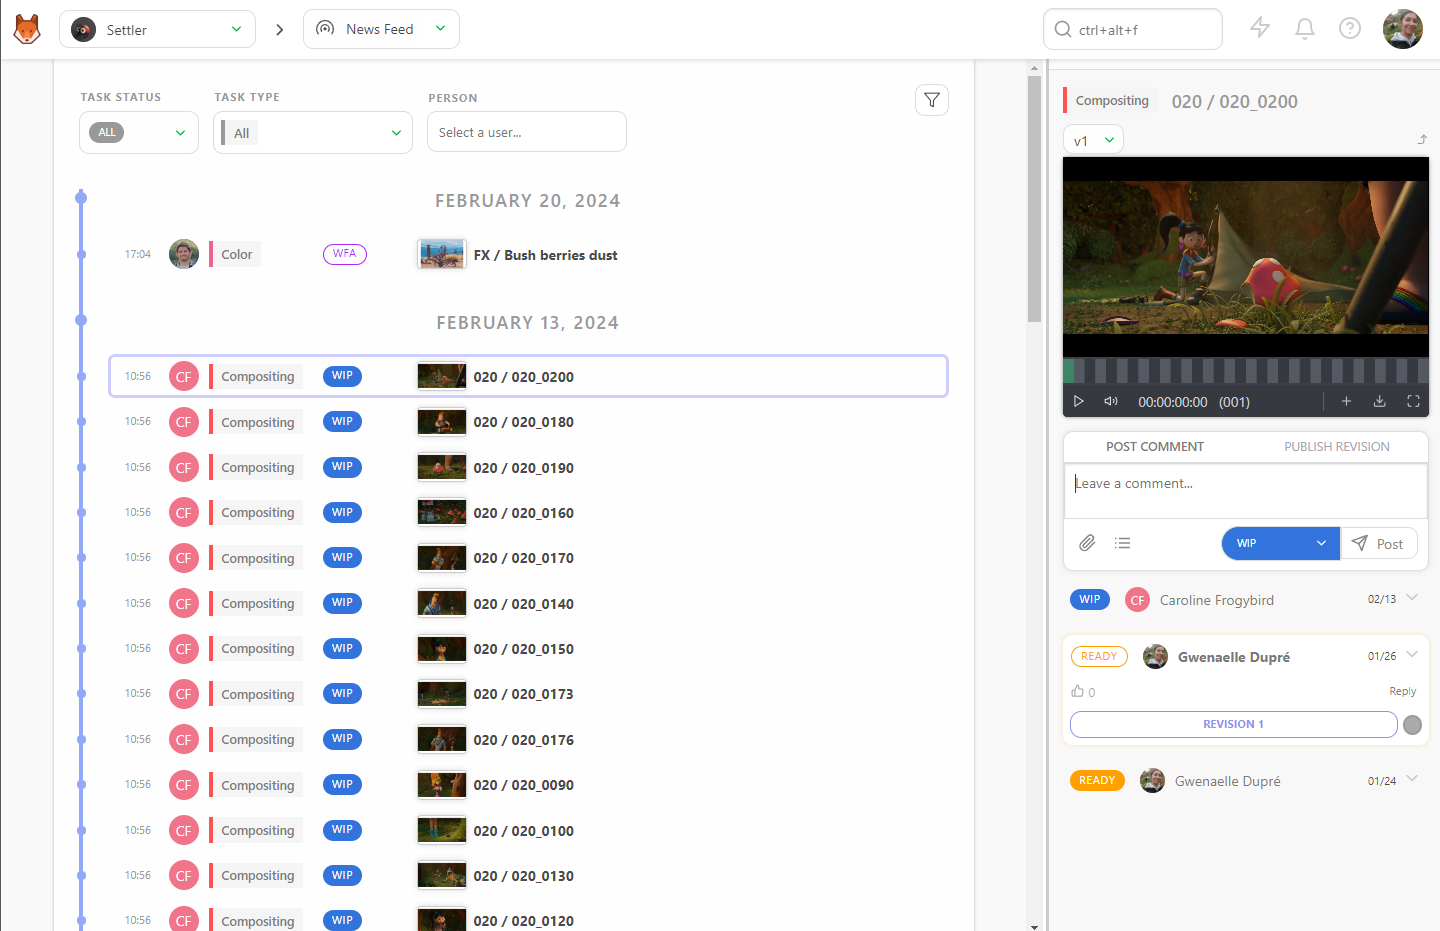
- Comment Panel: Clicking on a line opens the comment panel on the right, providing all necessary details.
Using Filters
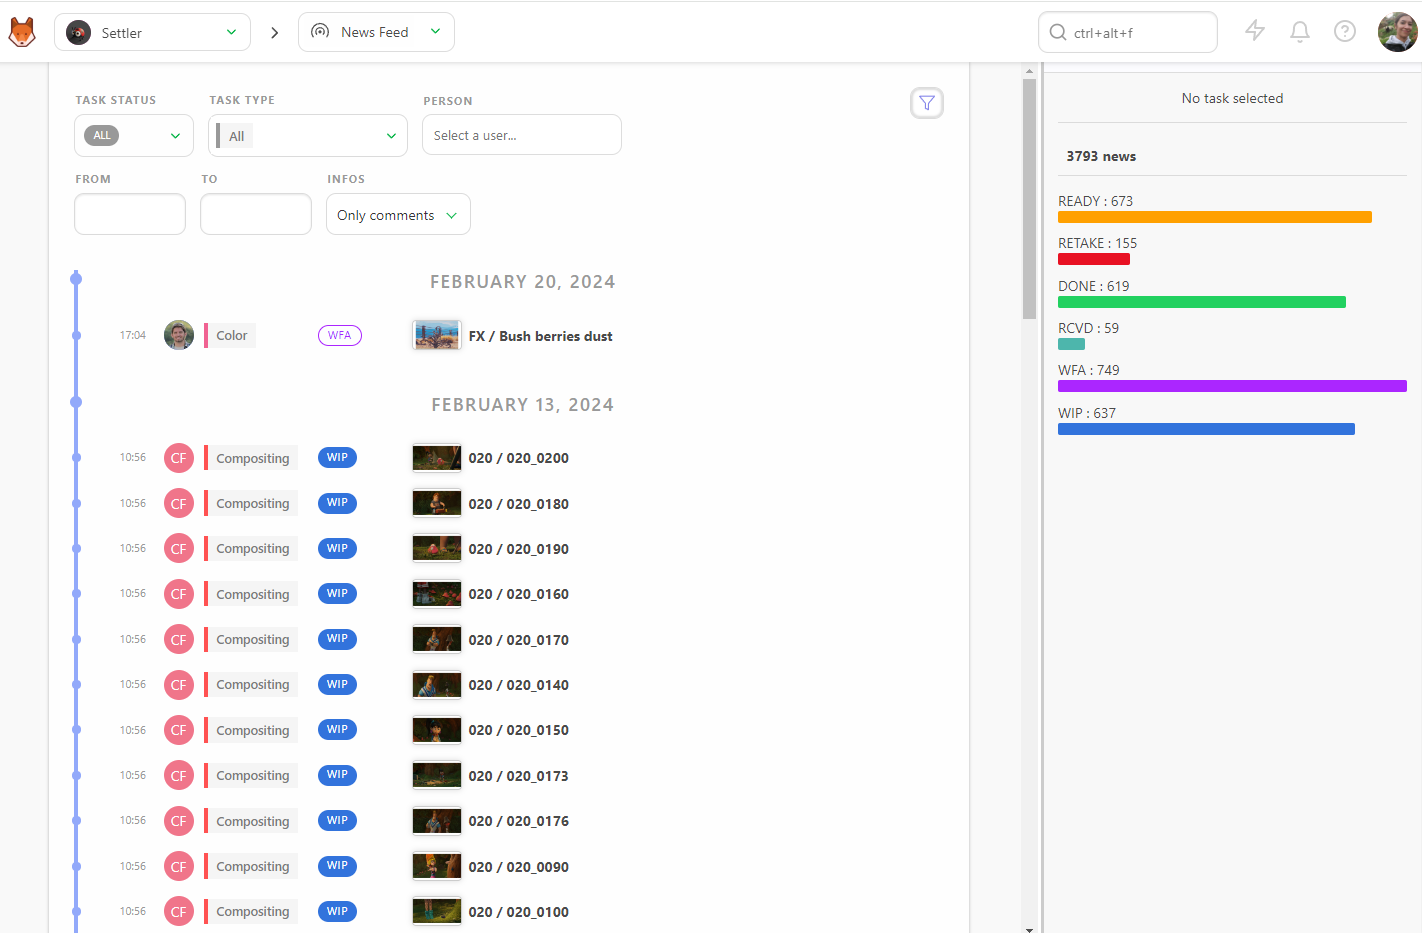
You can customize the time frame for displaying information using the Filters Builder button. This is useful for focusing on specific supervisors or time periods.
Example
If you want to focus on a supervisor for a specific month, select their name and pick a date in the From box.
Know the Current State of the Production
Understanding the current state of your production is crucial. Kitsu provides detailed statistics and visualizations, available both to you internally and to your client, to help you track progress effectively.
Short / Feature Specific
We're going to look at some features that are specific to Short / Feature Film workflows.
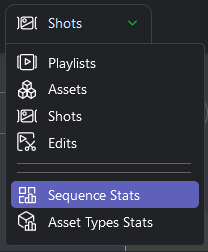
Sequence Stats
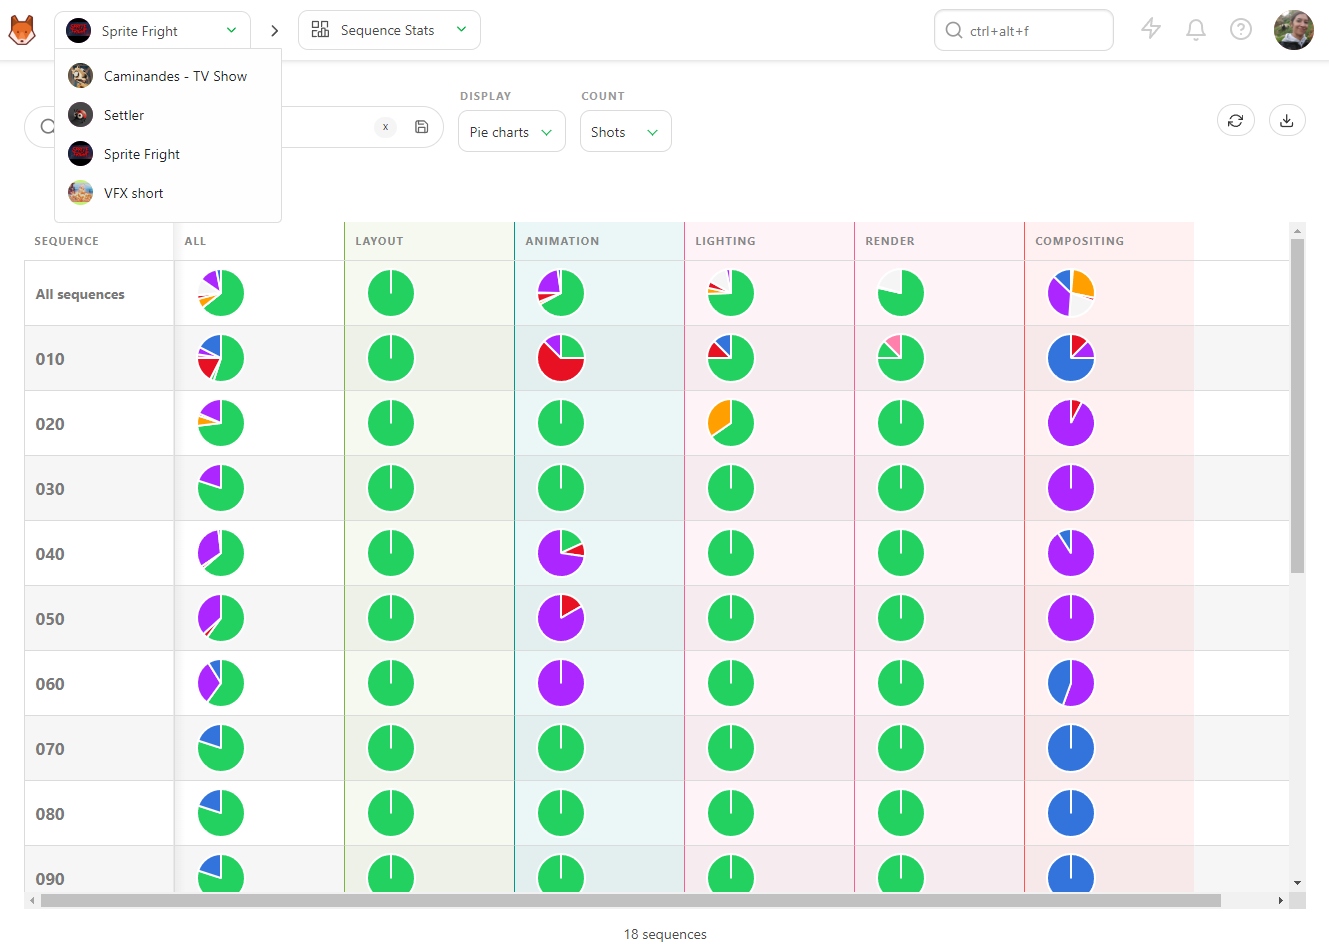
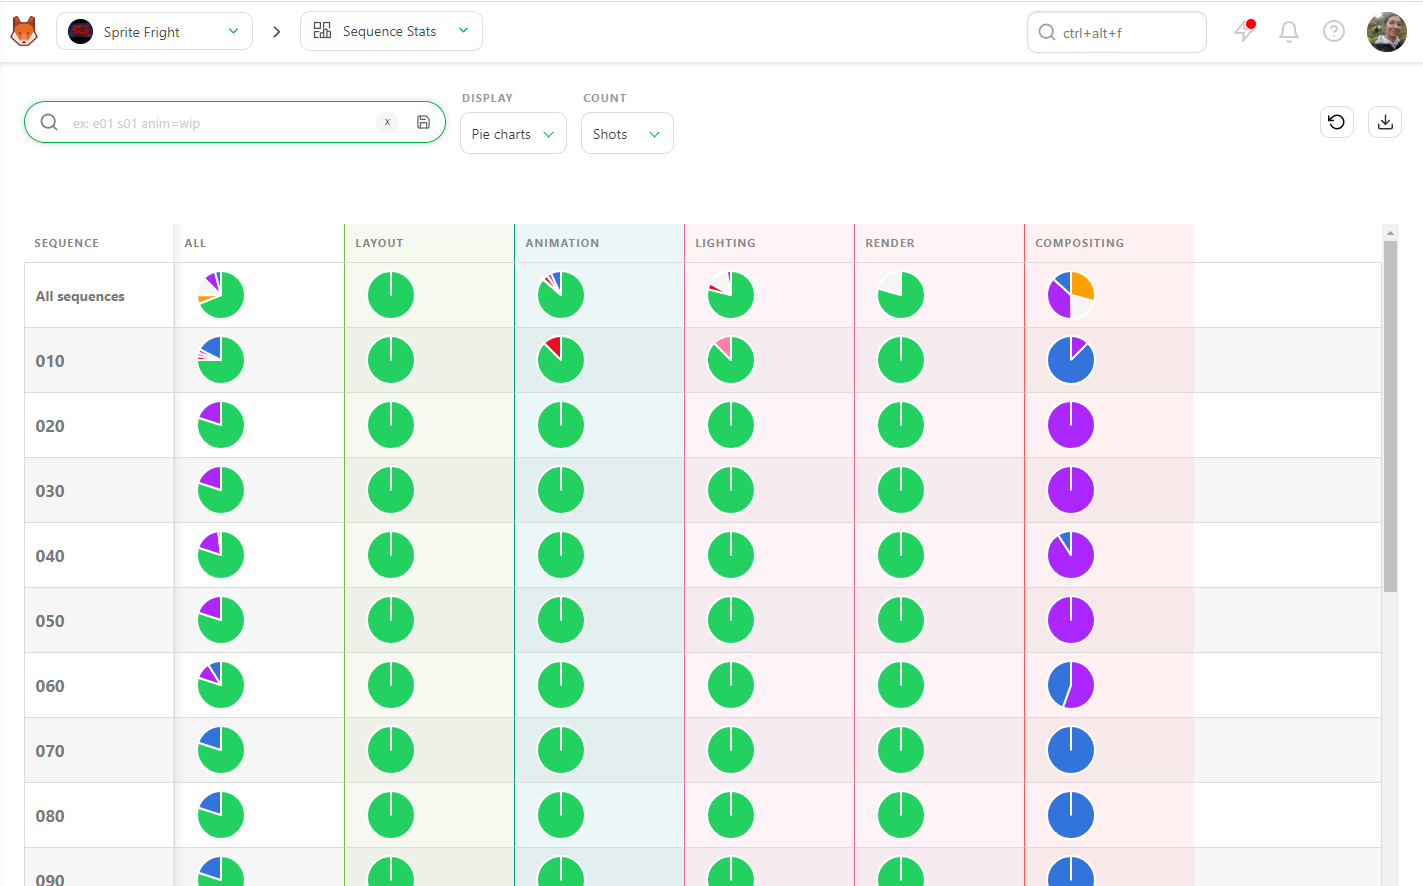
The Sequence Stats page offers pie charts that depict the status of your production, sequence by sequence. The color scheme of the pie charts corresponds to the status, allowing you to quickly understand the state of your production.
- All Sequences: The first line represents the whole production.
- All Tasks: The first column includes all tasks simultaneously.
By focusing on the first pie chart, you can see the exact state of your production. For more details, look at the rest of the line to get a global view of each task type's state.
Asset Types Stats
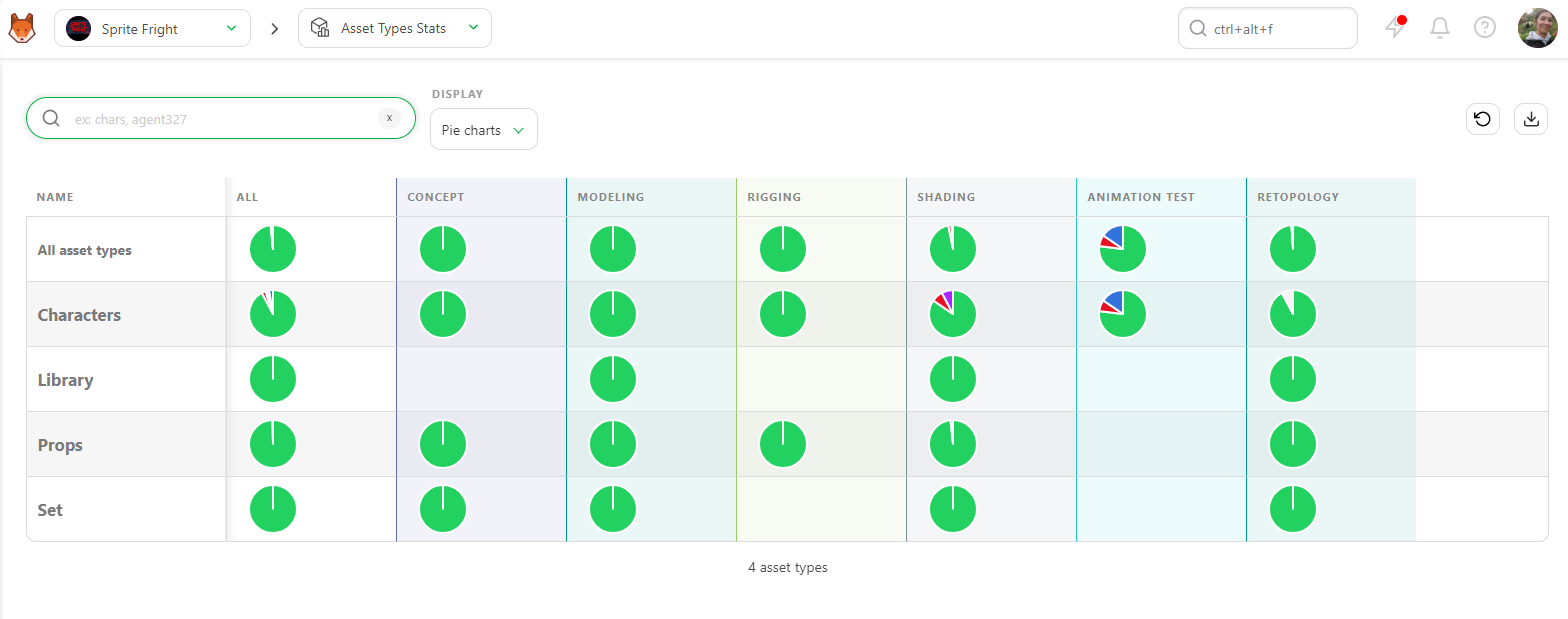
Similar to Sequence Stats, the Asset Types Stats page provides pie charts for asset types, giving you a clear view of the asset status across the production.
Count View
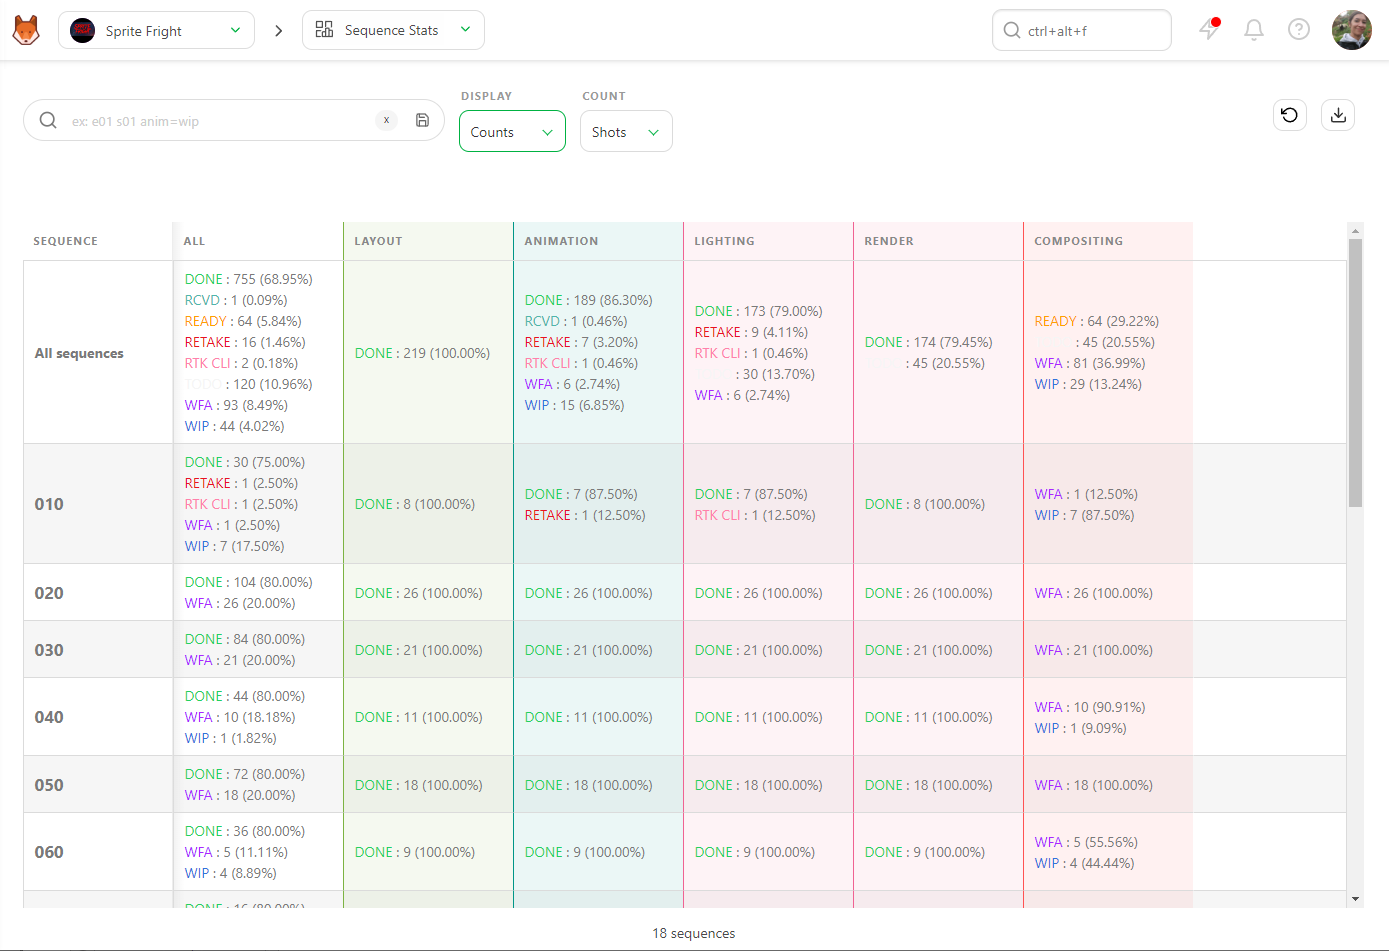
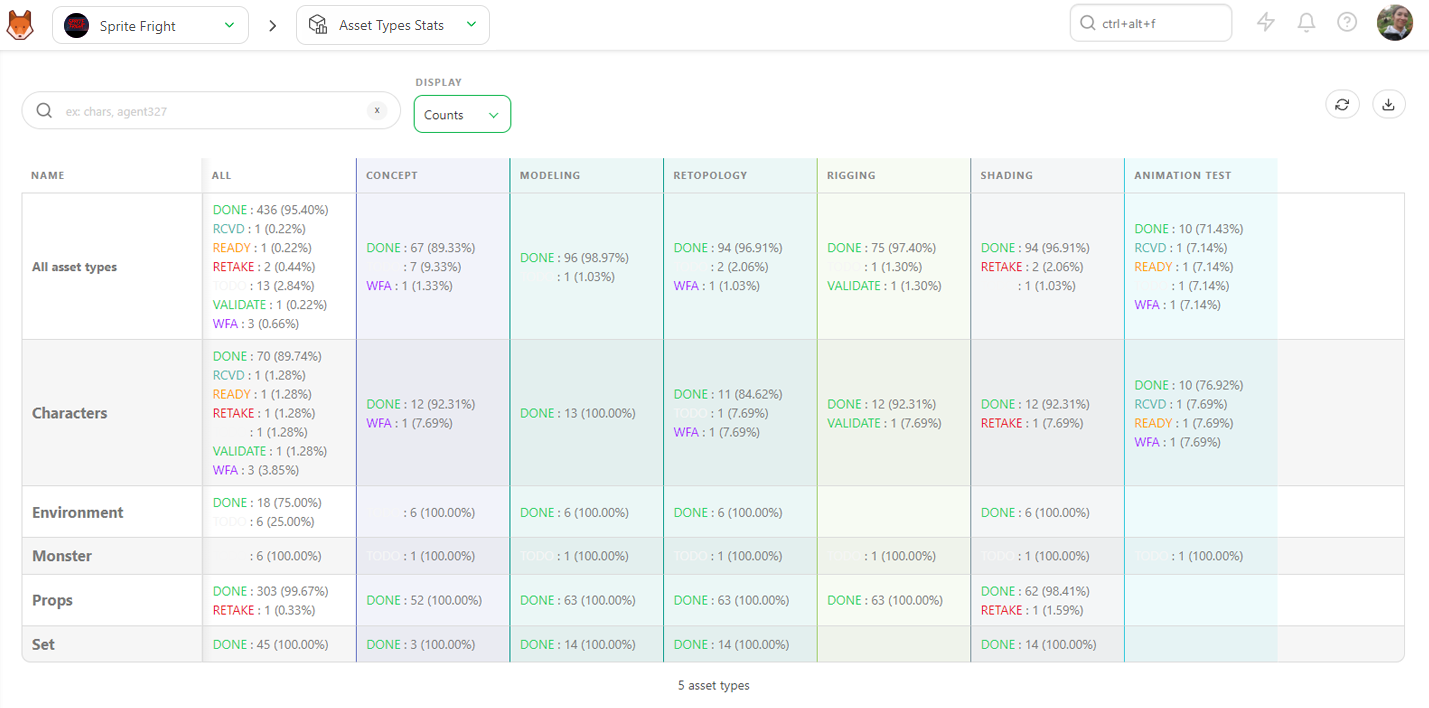
You can also display data as Counts to see the exact number of assets, shots, or frames, along with their percentage per status.
Exporting Data
You can export this page as a .csv text file and import it into spreadsheet software for further analysis and reporting.
By leveraging these tools, you can stay on top of the production process, ensuring everything runs smoothly and on schedule.
TV Show Specific
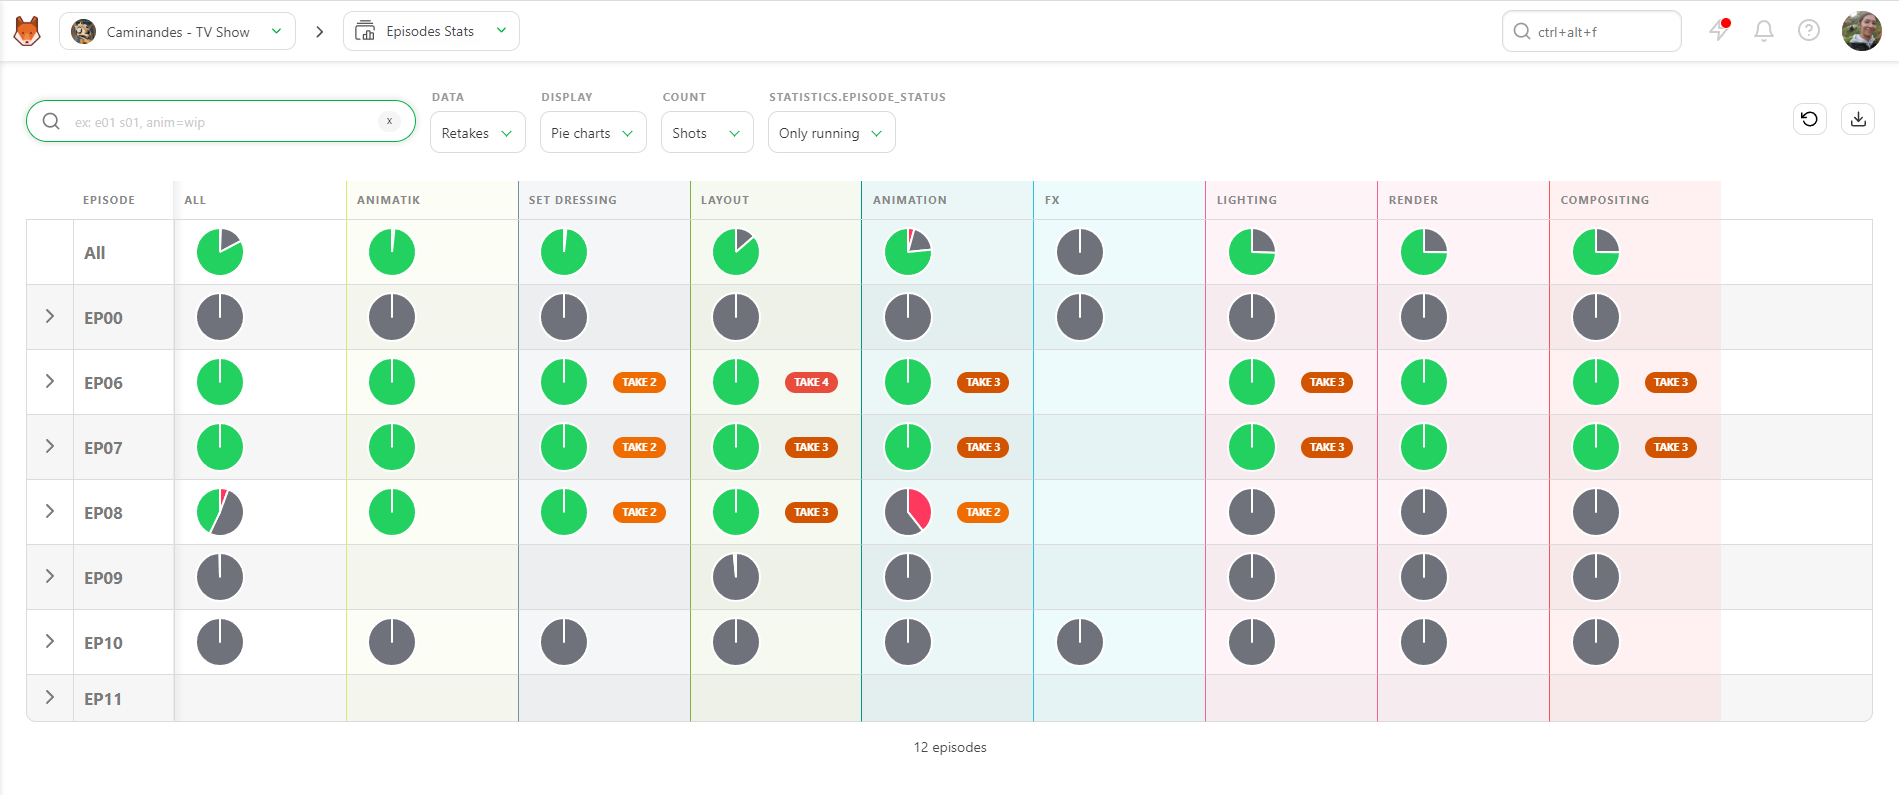
You can access an extra information level on a TV show through the Episodes Stats Page.
Retakes Display
The default setting for the Episodes Stats page is Retakes. This display lets you see the number of retakes (back and forth) for each episode on each task type. Only three colors are displayed:
- Validated as Green
- Retakes as Red
- In progress as Grey
If you unfold an episode, you will see the percentage of each take and the evolution of the retakes versus approval. This helps you see the progress of each episode per task.
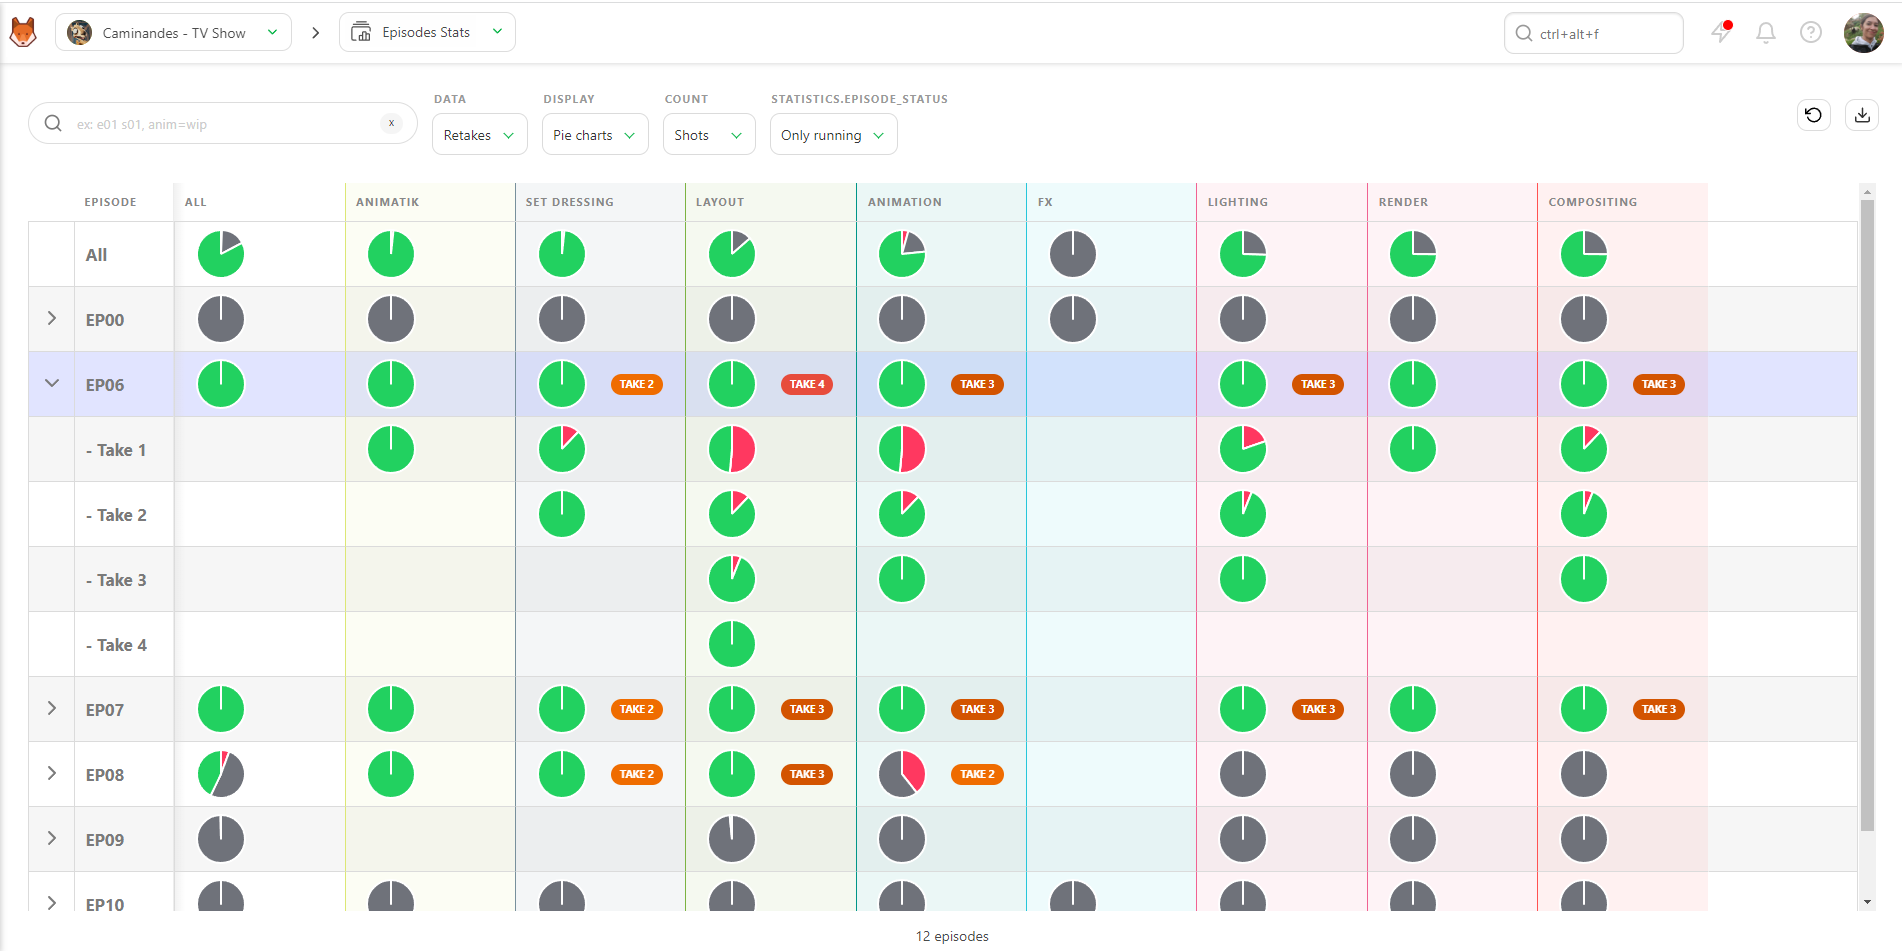
Usually, the first episodes have many back-and-forths, but it should get better over time. However, if late episodes still have many retakes, something must be fixed. It's time to discuss the issue with the director and the supervisor.
Status Display
The second option for data display is Status. This status display works like the Sequence / Asset Type Stats page.
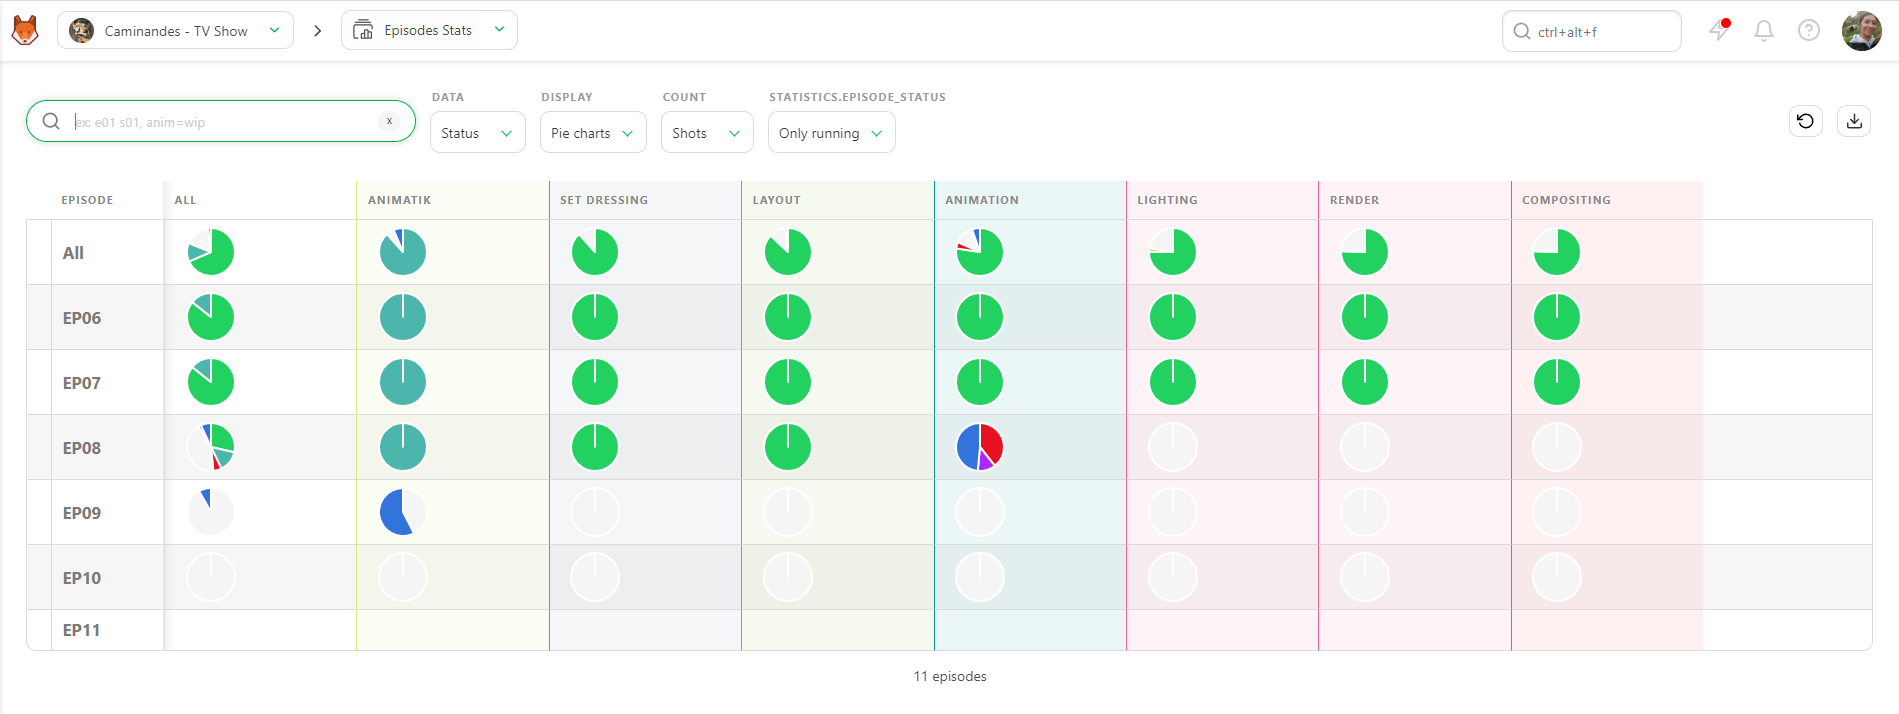
You can also display data as Counts. This way, you'll see the exact number of shots/frames with the percentage per status.
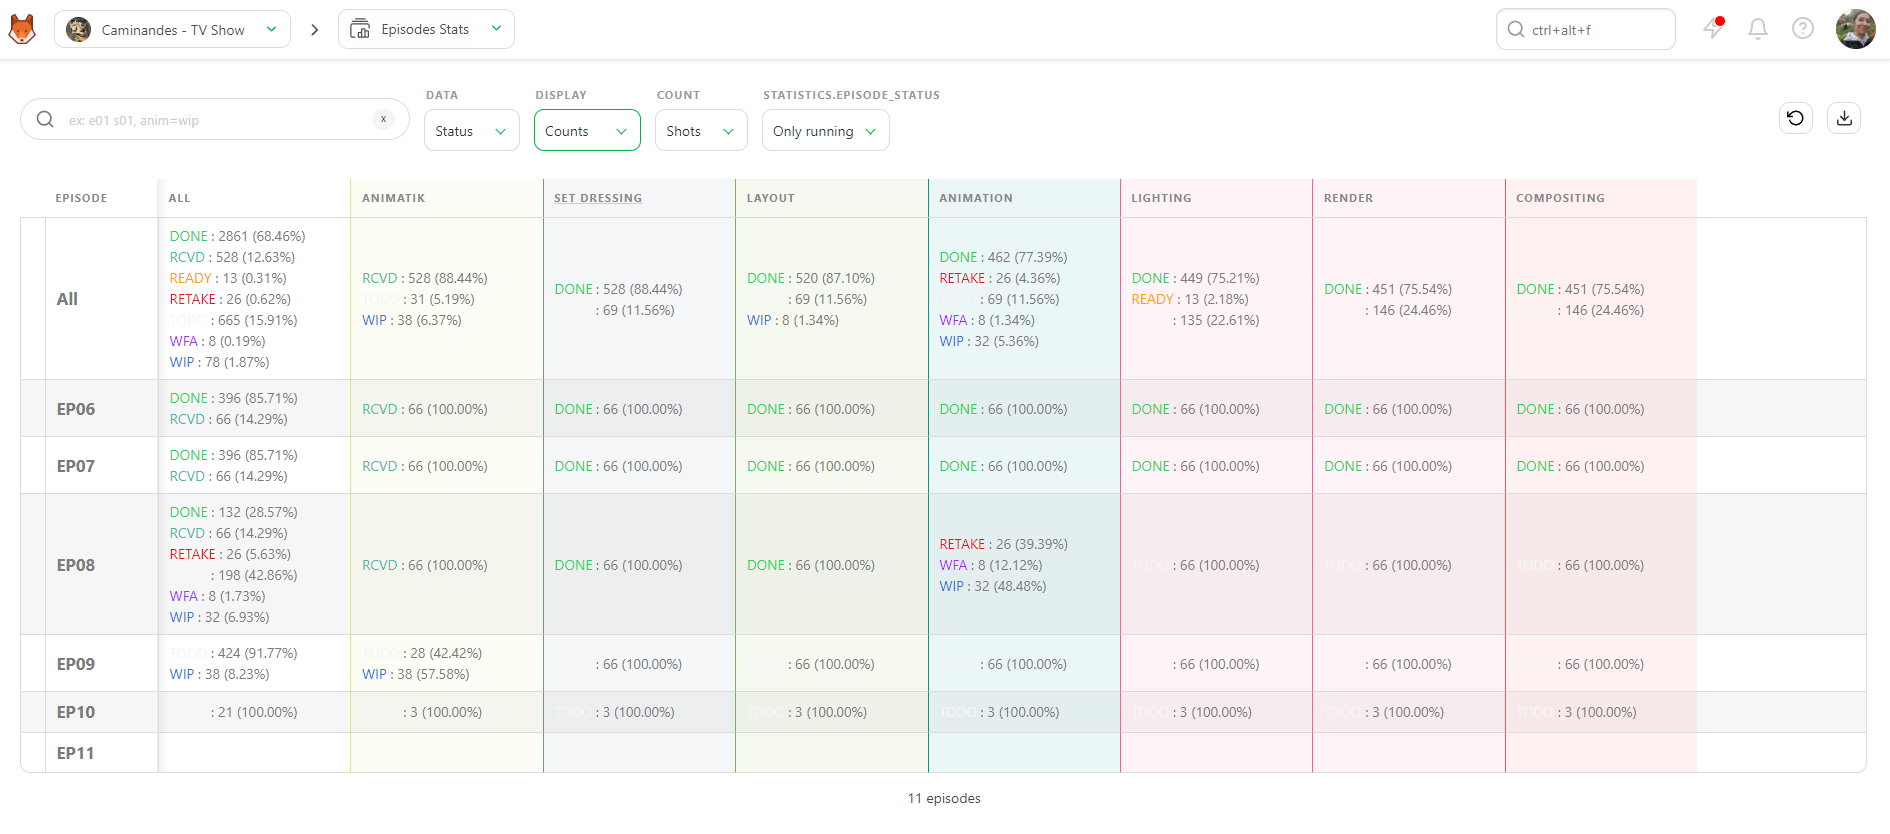
You can export this page as a .csv text file and import it into spreadsheet software.
Client Production Reports
To ease the communication with the studio, you have direct access to a client-facing version of the production report, mirroring the Sequence Stats and Asset Types Stats pages described above, and updated in real-time. Every time you look at this page, you are sure to have updated information.
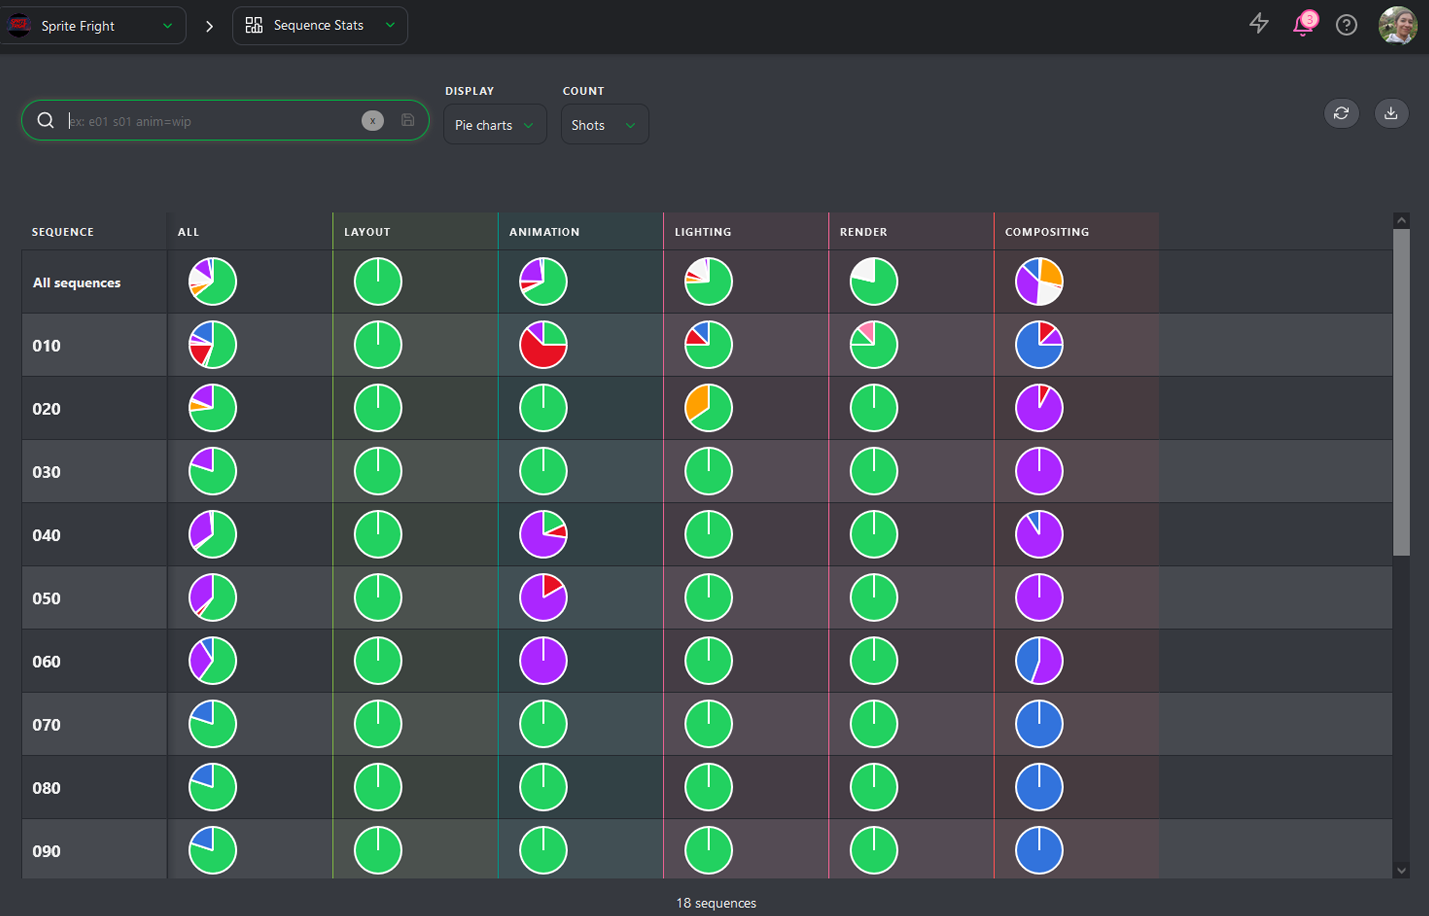
In this report, you can choose to display the stats per number of shots or number of frames, and switch the Display Mode between the Pie charts view and the Counts view, just as in the internal stats pages.
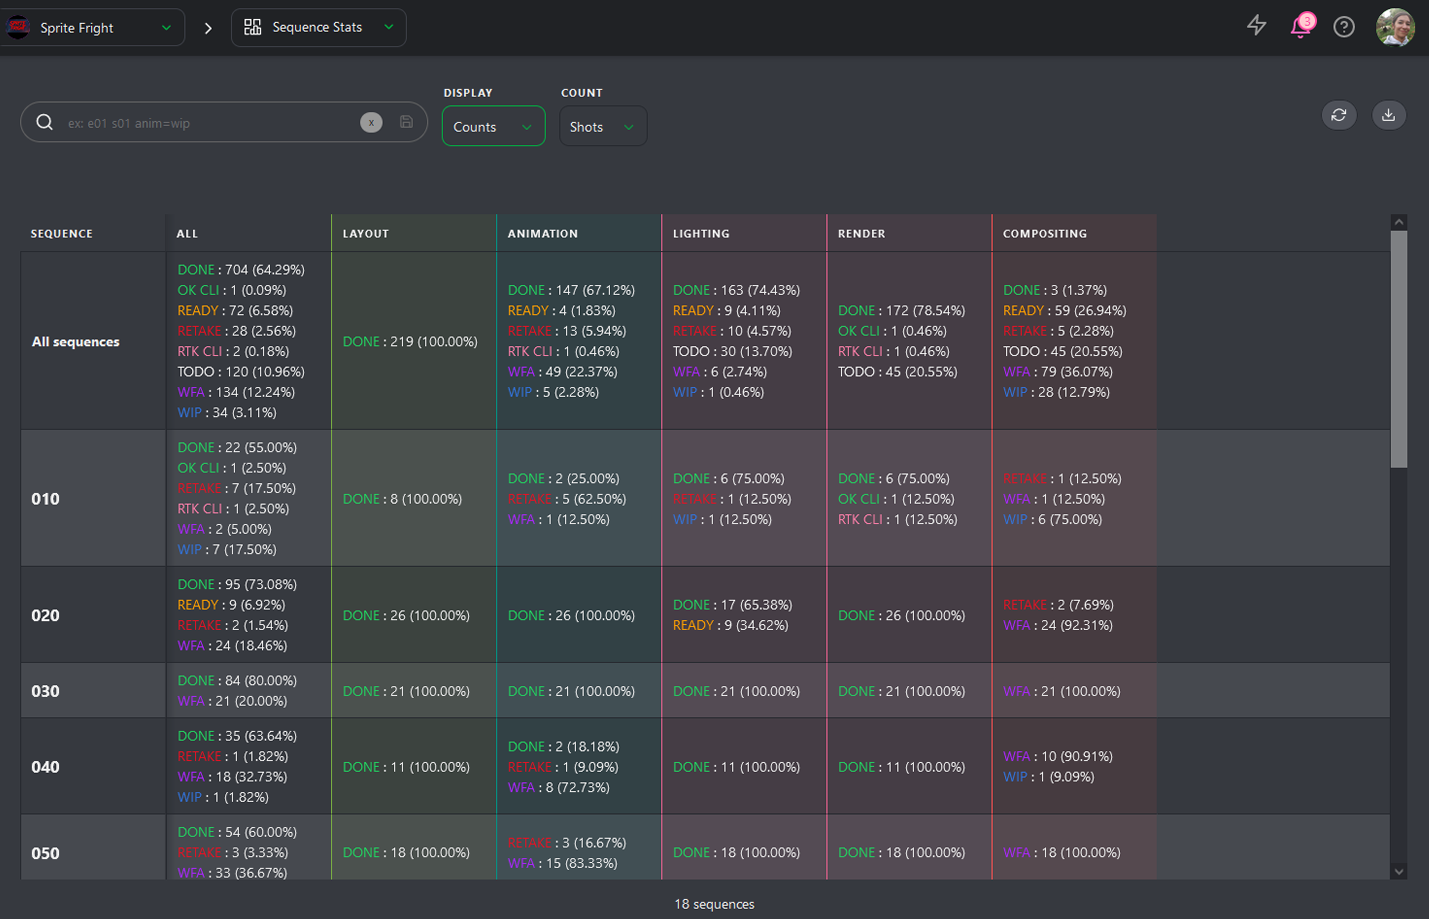
It's this presentation that you can download to keep track of the production progress.
As with the internal pages, you can export this page as a .csv text file to import it into spreadsheet software.
Navigate from production to production using the Navigation menu at the top of the screen. You will stay on the same page, allowing you to check all the production stats by selecting each production.